|
Download Data (XLS File) |
|
|||||
|
|||||
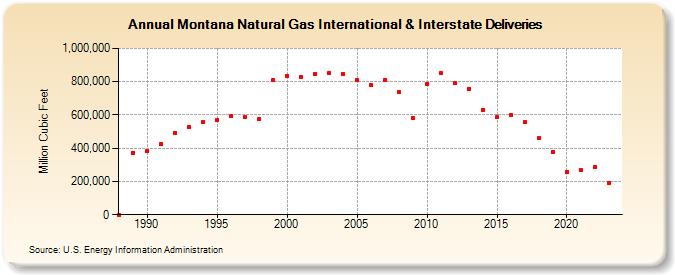
| Montana Natural Gas International & Interstate Deliveries (Million Cubic Feet) | |||||
| Decade | Year-0 | Year-1 | Year-2 | Year-3 | Year-4 | Year-5 | Year-6 | Year-7 | Year-8 | Year-9 |
|---|---|---|---|---|---|---|---|---|---|---|
| 1980's | 0 | 372,583 | ||||||||
| 1990's | 384,409 | 424,845 | 493,384 | 530,306 | 554,747 | 569,852 | 590,566 | 587,923 | 572,643 | 807,887 |
| 2000's | 833,089 | 828,970 | 846,088 | 852,072 | 847,081 | 808,284 | 781,177 | 810,804 | 734,836 | 583,385 |
| 2010's | 788,042 | 851,620 | 791,052 | 758,270 | 628,814 | 584,819 | 600,049 | 554,722 | 459,277 | 378,962 |
| 2020's | 257,802 | 266,101 | 288,388 |
| - = No Data Reported; -- = Not Applicable; NA = Not Available; W = Withheld to avoid disclosure of individual company data. |
| Release Date: 3/29/2024 |
| Next Release Date: 4/30/2024 |