|
Download Data (XLS File) |
|
|||||
|
|||||
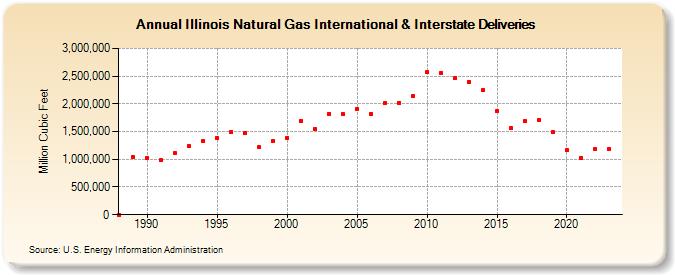
| Illinois Natural Gas International & Interstate Deliveries (Million Cubic Feet) | |||||
| Decade | Year-0 | Year-1 | Year-2 | Year-3 | Year-4 | Year-5 | Year-6 | Year-7 | Year-8 | Year-9 |
|---|---|---|---|---|---|---|---|---|---|---|
| 1980's | 0 | 1,048,895 | ||||||||
| 1990's | 1,023,874 | 981,904 | 1,112,815 | 1,234,731 | 1,328,116 | 1,388,479 | 1,498,747 | 1,475,069 | 1,221,336 | 1,325,077 |
| 2000's | 1,391,241 | 1,698,828 | 1,547,601 | 1,824,428 | 1,815,994 | 1,912,671 | 1,812,882 | 2,011,543 | 2,022,380 | 2,146,637 |
| 2010's | 2,565,698 | 2,561,463 | 2,464,407 | 2,398,988 | 2,242,317 | 1,874,035 | 1,562,998 | 1,682,166 | 1,707,525 | 1,487,342 |
| 2020's | 1,162,770 | 1,030,570 | 1,176,845 |
| - = No Data Reported; -- = Not Applicable; NA = Not Available; W = Withheld to avoid disclosure of individual company data. |
| Release Date: 3/29/2024 |
| Next Release Date: 4/30/2024 |