|
Download Data (XLS File) |
|
|||||
|
|||||
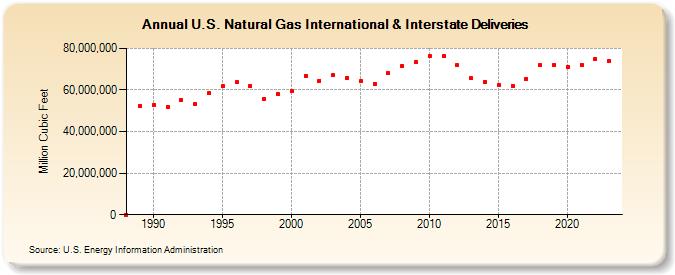
| U.S. Natural Gas International & Interstate Deliveries (Million Cubic Feet) | |||||
| Decade | Year-0 | Year-1 | Year-2 | Year-3 | Year-4 | Year-5 | Year-6 | Year-7 | Year-8 | Year-9 |
|---|---|---|---|---|---|---|---|---|---|---|
| 1980's | 0 | 52,425,748 | ||||||||
| 1990's | 52,911,554 | 51,844,587 | 55,198,462 | 53,138,328 | 58,604,178 | 61,813,651 | 63,643,603 | 61,873,174 | 55,758,142 | 57,984,679 |
| 2000's | 59,330,570 | 66,722,998 | 64,436,165 | 67,122,148 | 65,776,430 | 64,215,521 | 63,074,138 | 68,142,526 | 71,681,271 | 73,403,878 |
| 2010's | 76,240,152 | 76,241,511 | 71,817,737 | 65,724,268 | 64,055,041 | 62,336,372 | 62,031,074 | 65,380,753 | 72,045,258 | 72,100,725 |
| 2020's | 71,044,218 | 72,204,458 | 75,034,178 |
| - = No Data Reported; -- = Not Applicable; NA = Not Available; W = Withheld to avoid disclosure of individual company data. |
| Release Date: 8/30/2024 |
| Next Release Date: 9/30/2024 |
Referring Pages: