|
Download Data (XLS File) |
|
|||||
|
|||||
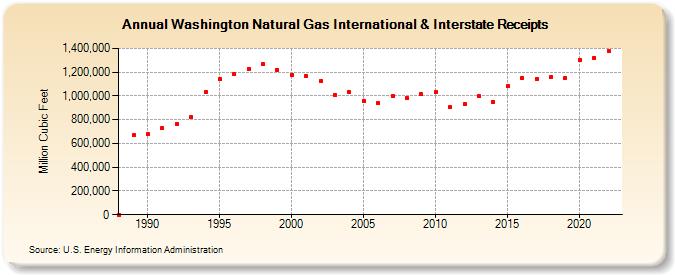
| Washington Natural Gas International & Interstate Receipts (Million Cubic Feet) | |||||
| Decade | Year-0 | Year-1 | Year-2 | Year-3 | Year-4 | Year-5 | Year-6 | Year-7 | Year-8 | Year-9 |
|---|---|---|---|---|---|---|---|---|---|---|
| 1980's | 0 | 668,626 | ||||||||
| 1990's | 677,147 | 729,088 | 761,678 | 821,668 | 1,033,463 | 1,140,487 | 1,180,708 | 1,228,082 | 1,266,749 | 1,218,709 |
| 2000's | 1,179,259 | 1,170,229 | 1,127,581 | 1,009,532 | 1,032,832 | 958,103 | 942,318 | 1,002,555 | 981,762 | 1,013,618 |
| 2010's | 1,029,914 | 903,623 | 931,061 | 995,716 | 947,715 | 1,082,637 | 1,152,625 | 1,145,014 | 1,159,390 | 1,154,477 |
| 2020's | 1,306,276 | 1,323,309 | 1,381,814 |
| - = No Data Reported; -- = Not Applicable; NA = Not Available; W = Withheld to avoid disclosure of individual company data. |
| Release Date: 4/30/2024 |
| Next Release Date: 5/31/2024 |