|
Download Data (XLS File) |
|
|||||
|
|||||
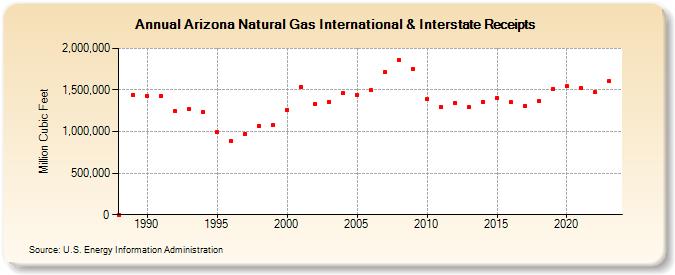
| Arizona Natural Gas International & Interstate Receipts (Million Cubic Feet) | |||||
| Decade | Year-0 | Year-1 | Year-2 | Year-3 | Year-4 | Year-5 | Year-6 | Year-7 | Year-8 | Year-9 |
|---|---|---|---|---|---|---|---|---|---|---|
| 1980's | 0 | 1,443,075 | ||||||||
| 1990's | 1,428,400 | 1,430,709 | 1,244,223 | 1,270,649 | 1,234,695 | 994,103 | 883,918 | 969,669 | 1,069,361 | 1,076,545 |
| 2000's | 1,262,272 | 1,539,775 | 1,335,254 | 1,360,744 | 1,460,182 | 1,444,317 | 1,496,283 | 1,715,762 | 1,858,155 | 1,752,883 |
| 2010's | 1,387,647 | 1,292,554 | 1,343,455 | 1,294,444 | 1,361,147 | 1,405,172 | 1,350,141 | 1,308,749 | 1,365,513 | 1,516,316 |
| 2020's | 1,544,395 | 1,529,159 | 1,472,408 |
| - = No Data Reported; -- = Not Applicable; NA = Not Available; W = Withheld to avoid disclosure of individual company data. |
| Release Date: 4/30/2024 |
| Next Release Date: 5/31/2024 |