|
Download Data (XLS File) |
|
|||||
|
|||||
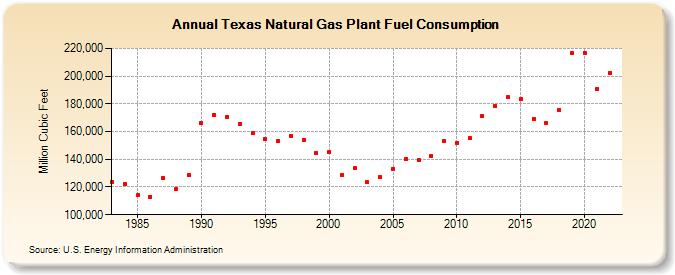
| Texas Natural Gas Plant Fuel Consumption (Million Cubic Feet) | |||||
| Decade | Year-0 | Year-1 | Year-2 | Year-3 | Year-4 | Year-5 | Year-6 | Year-7 | Year-8 | Year-9 |
|---|---|---|---|---|---|---|---|---|---|---|
| 1980's | 123,847 | 122,272 | 113,937 | 113,093 | 126,712 | 118,683 | 128,759 | |||
| 1990's | 166,120 | 172,035 | 170,734 | 165,507 | 158,826 | 154,721 | 153,039 | 157,013 | 153,966 | 144,544 |
| 2000's | 144,971 | 128,836 | 133,427 | 123,383 | 127,356 | 133,306 | 140,414 | 139,262 | 142,476 | 152,948 |
| 2010's | 151,818 | 155,358 | 171,359 | 178,682 | 184,723 | 183,429 | 169,360 | 166,479 | 175,653 | 216,783 |
| 2020's | 217,005 | 190,724 | 202,482 |
| - = No Data Reported; -- = Not Applicable; NA = Not Available; W = Withheld to avoid disclosure of individual company data. |
| Release Date: 4/30/2024 |
| Next Release Date: 5/31/2024 |