|
Download Data (XLS File) |
|
|||||
|
|||||
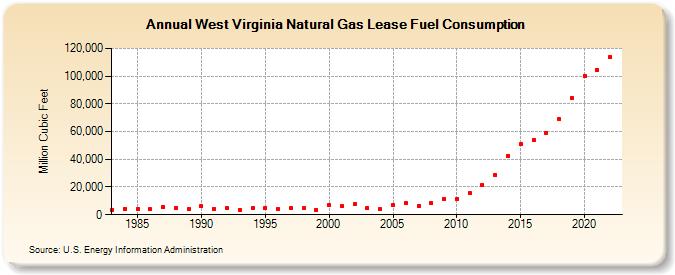
| West Virginia Natural Gas Lease Fuel Consumption (Million Cubic Feet) | |||||
| Decade | Year-0 | Year-1 | Year-2 | Year-3 | Year-4 | Year-5 | Year-6 | Year-7 | Year-8 | Year-9 |
|---|---|---|---|---|---|---|---|---|---|---|
| 1980's | 3,720 | 4,377 | 4,270 | 3,849 | 5,480 | 5,017 | 4,203 | |||
| 1990's | 6,427 | 4,353 | 4,807 | 3,749 | 4,815 | 4,846 | 4,292 | 4,500 | 4,549 | 3,705 |
| 2000's | 6,720 | 6,384 | 7,420 | 4,881 | 4,277 | 6,729 | 8,339 | 6,483 | 8,423 | 11,348 |
| 2010's | 11,348 | 15,571 | 21,569 | 28,682 | 42,427 | 50,851 | 54,045 | 59,224 | 69,002 | 84,053 |
| 2020's | 100,152 | 104,331 | 113,904 |
| - = No Data Reported; -- = Not Applicable; NA = Not Available; W = Withheld to avoid disclosure of individual company data. |
| Release Date: 8/30/2024 |
| Next Release Date: 9/30/2024 |