|
Download Data (XLS File) |
|
|||||
|
|||||
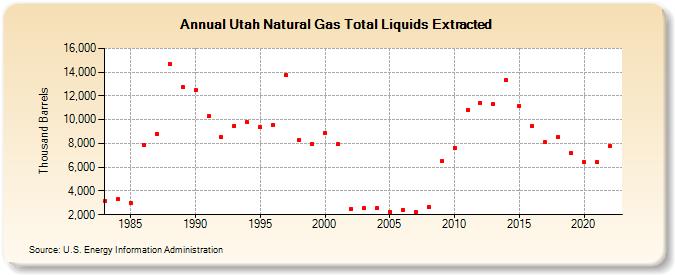
| Utah Natural Gas Total Liquids Extracted (Thousand Barrels) | |||||
| Decade | Year-0 | Year-1 | Year-2 | Year-3 | Year-4 | Year-5 | Year-6 | Year-7 | Year-8 | Year-9 |
|---|---|---|---|---|---|---|---|---|---|---|
| 1980's | 3,146 | 3,282 | 2,992 | 7,846 | 8,831 | 14,712 | 12,712 | |||
| 1990's | 12,461 | 10,275 | 8,513 | 9,475 | 9,763 | 9,381 | 9,547 | 13,757 | 8,280 | 7,974 |
| 2000's | 8,870 | 7,930 | 2,519 | 2,532 | 2,556 | 2,250 | 2,418 | 2,241 | 2,643 | 6,527 |
| 2010's | 7,648 | 10,805 | 11,441 | 11,279 | 13,343 | 11,165 | 9,465 | 8,087 | 8,562 | 7,159 |
| 2020's | 6,459 | 6,430 | 7,771 |
| - = No Data Reported; -- = Not Applicable; NA = Not Available; W = Withheld to avoid disclosure of individual company data. |
| Release Date: 3/29/2024 |
| Next Release Date: 4/30/2024 |
Referring Pages: