|
Download Data (XLS File) |
|
|||||
|
|||||
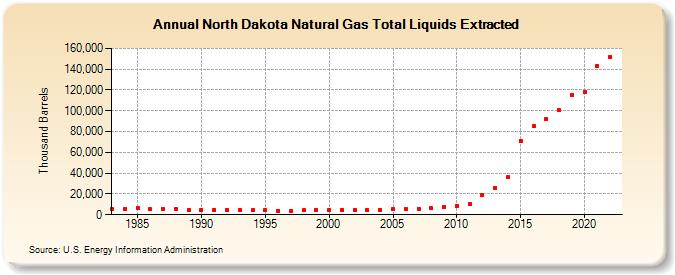
| North Dakota Natural Gas Total Liquids Extracted (Thousand Barrels) | |||||
| Decade | Year-0 | Year-1 | Year-2 | Year-3 | Year-4 | Year-5 | Year-6 | Year-7 | Year-8 | Year-9 |
|---|---|---|---|---|---|---|---|---|---|---|
| 1980's | 5,422 | 5,930 | 6,320 | 5,246 | 5,952 | 5,335 | 4,674 | |||
| 1990's | 4,942 | 4,852 | 4,675 | 4,563 | 4,278 | 4,093 | 3,860 | 3,897 | 4,234 | 4,462 |
| 2000's | 4,598 | 4,712 | 4,610 | 4,448 | 4,754 | 5,250 | 5,560 | 5,647 | 6,184 | 7,852 |
| 2010's | 8,842 | 10,199 | 19,186 | 26,000 | 36,276 | 71,232 | 85,227 | 92,505 | 100,815 | 115,406 |
| 2020's | 118,520 | 142,878 | 151,747 |
| - = No Data Reported; -- = Not Applicable; NA = Not Available; W = Withheld to avoid disclosure of individual company data. |
| Release Date: 3/29/2024 |
| Next Release Date: 4/30/2024 |