|
Download Data (XLS File) |
|
|||||
|
|||||
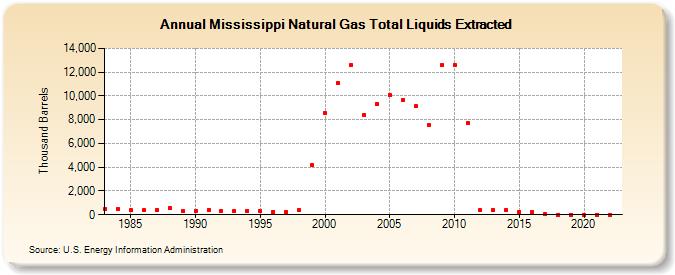
| Mississippi Natural Gas Total Liquids Extracted (Thousand Barrels) | |||||
| Decade | Year-0 | Year-1 | Year-2 | Year-3 | Year-4 | Year-5 | Year-6 | Year-7 | Year-8 | Year-9 |
|---|---|---|---|---|---|---|---|---|---|---|
| 1980's | 497 | 501 | 362 | 366 | 358 | 576 | 318 | |||
| 1990's | 338 | 408 | 319 | 305 | 337 | 313 | 254 | 232 | 370 | 4,149 |
| 2000's | 8,525 | 11,088 | 12,615 | 8,431 | 9,333 | 10,076 | 9,666 | 9,133 | 7,563 | 12,591 |
| 2010's | 12,618 | 7,732 | 377 | 359 | 365 | 257 | 201 | 25 | 5 | 4 |
| 2020's | 3 | 3 | 1 |
| - = No Data Reported; -- = Not Applicable; NA = Not Available; W = Withheld to avoid disclosure of individual company data. |
| Release Date: 3/29/2024 |
| Next Release Date: 4/30/2024 |