|
Download Data (XLS File) |
|
|||||
|
|||||
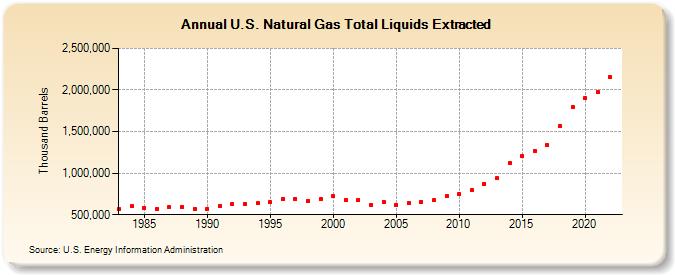
| U.S. Natural Gas Total Liquids Extracted (Thousand Barrels) | |||||
| Decade | Year-0 | Year-1 | Year-2 | Year-3 | Year-4 | Year-5 | Year-6 | Year-7 | Year-8 | Year-9 |
|---|---|---|---|---|---|---|---|---|---|---|
| 1980's | 569,968 | 599,518 | 584,160 | 571,256 | 587,502 | 594,306 | 569,913 | |||
| 1990's | 573,054 | 602,734 | 626,320 | 634,481 | 635,983 | 649,149 | 689,314 | 690,999 | 668,011 | 686,862 |
| 2000's | 721,895 | 682,873 | 681,646 | 622,291 | 657,032 | 619,884 | 637,635 | 658,291 | 673,677 | 720,612 |
| 2010's | 749,095 | 792,481 | 873,563 | 937,591 | 1,124,416 | 1,210,220 | 1,271,986 | 1,334,298 | 1,564,626 | 1,796,709 |
| 2020's | 1,902,659 | 1,970,214 | 2,153,495 |
| - = No Data Reported; -- = Not Applicable; NA = Not Available; W = Withheld to avoid disclosure of individual company data. |
| Release Date: 3/29/2024 |
| Next Release Date: 4/30/2024 |
Referring Pages: