|
Download Data (XLS File) |
|
|||||
|
|||||
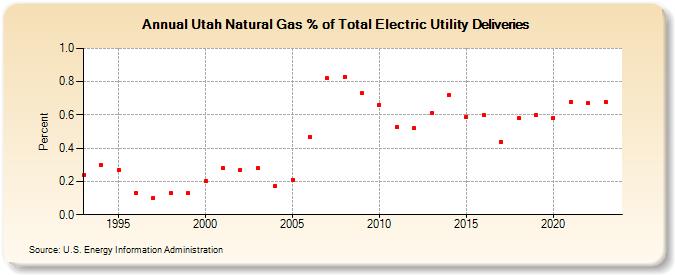
| Utah Natural Gas % of Total Electric Utility Deliveries (Percent) | |||||
| Decade | Year-0 | Year-1 | Year-2 | Year-3 | Year-4 | Year-5 | Year-6 | Year-7 | Year-8 | Year-9 |
|---|---|---|---|---|---|---|---|---|---|---|
| 1990's | 0.24 | 0.30 | 0.27 | 0.13 | 0.10 | 0.13 | 0.13 | |||
| 2000's | 0.20 | 0.28 | 0.27 | 0.28 | 0.17 | 0.21 | 0.47 | 0.82 | 0.83 | 0.73 |
| 2010's | 0.66 | 0.53 | 0.52 | 0.61 | 0.72 | 0.59 | 0.60 | 0.44 | 0.58 | 0.60 |
| 2020's | 0.58 | 0.68 | 0.66 |
| - = No Data Reported; -- = Not Applicable; NA = Not Available; W = Withheld to avoid disclosure of individual company data. |
| Release Date: 3/29/2024 |
| Next Release Date: 4/30/2024 |