|
Download Data (XLS File) |
|
|||||
|
|||||
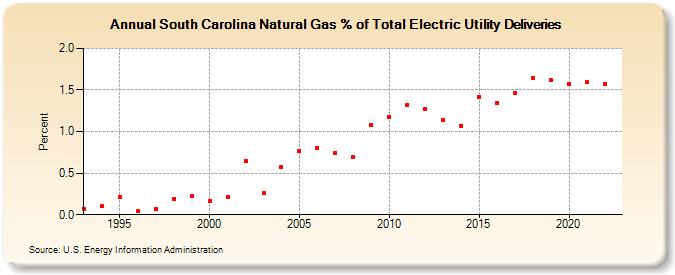
| South Carolina Natural Gas % of Total Electric Utility Deliveries (Percent) | |||||
| Decade | Year-0 | Year-1 | Year-2 | Year-3 | Year-4 | Year-5 | Year-6 | Year-7 | Year-8 | Year-9 |
|---|---|---|---|---|---|---|---|---|---|---|
| 1990's | 0.07 | 0.10 | 0.21 | 0.04 | 0.07 | 0.19 | 0.22 | |||
| 2000's | 0.16 | 0.21 | 0.65 | 0.26 | 0.57 | 0.77 | 0.80 | 0.74 | 0.69 | 1.08 |
| 2010's | 1.18 | 1.32 | 1.27 | 1.14 | 1.07 | 1.42 | 1.34 | 1.46 | 1.64 | 1.62 |
| 2020's | 1.57 | 1.59 | 1.57 |
| - = No Data Reported; -- = Not Applicable; NA = Not Available; W = Withheld to avoid disclosure of individual company data. |
| Release Date: 4/30/2024 |
| Next Release Date: 5/31/2024 |