|
Download Data (XLS File) |
|
|||||
|
|||||
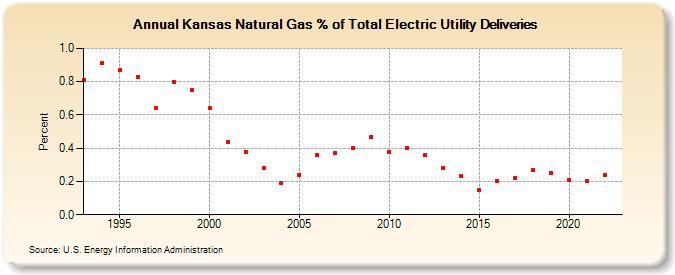
| Kansas Natural Gas % of Total Electric Utility Deliveries (Percent) | |||||
| Decade | Year-0 | Year-1 | Year-2 | Year-3 | Year-4 | Year-5 | Year-6 | Year-7 | Year-8 | Year-9 |
|---|---|---|---|---|---|---|---|---|---|---|
| 1990's | 0.81 | 0.91 | 0.87 | 0.83 | 0.64 | 0.80 | 0.75 | |||
| 2000's | 0.64 | 0.44 | 0.38 | 0.28 | 0.19 | 0.24 | 0.36 | 0.37 | 0.40 | 0.47 |
| 2010's | 0.38 | 0.40 | 0.36 | 0.28 | 0.23 | 0.15 | 0.20 | 0.22 | 0.27 | 0.25 |
| 2020's | 0.21 | 0.20 | 0.24 |
| - = No Data Reported; -- = Not Applicable; NA = Not Available; W = Withheld to avoid disclosure of individual company data. |
| Release Date: 3/29/2024 |
| Next Release Date: 4/30/2024 |