|
Download Data (XLS File) |
|
|||||
|
|||||
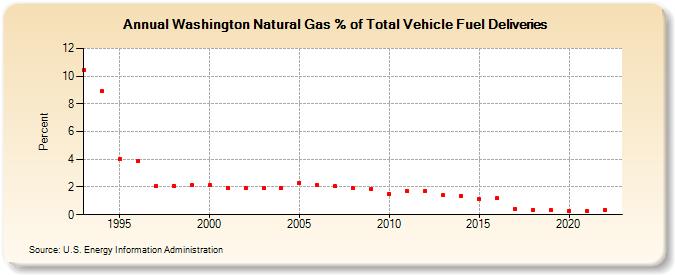
| Washington Natural Gas % of Total Vehicle Fuel Deliveries (Percent) | |||||
| Decade | Year-0 | Year-1 | Year-2 | Year-3 | Year-4 | Year-5 | Year-6 | Year-7 | Year-8 | Year-9 |
|---|---|---|---|---|---|---|---|---|---|---|
| 1990's | 10.42 | 8.90 | 4.00 | 3.86 | 2.06 | 2.10 | 2.11 | |||
| 2000's | 2.11 | 1.95 | 1.93 | 1.93 | 1.93 | 2.30 | 2.11 | 2.05 | 1.90 | 1.87 |
| 2010's | 1.52 | 1.70 | 1.71 | 1.39 | 1.37 | 1.13 | 1.18 | 0.42 | 0.36 | 0.32 |
| 2020's | 0.25 | 0.25 | 0.35 |
| - = No Data Reported; -- = Not Applicable; NA = Not Available; W = Withheld to avoid disclosure of individual company data. |
| Release Date: 3/29/2024 |
| Next Release Date: 4/30/2024 |