|
Download Data (XLS File) |
|
||||||||
|
||||||||
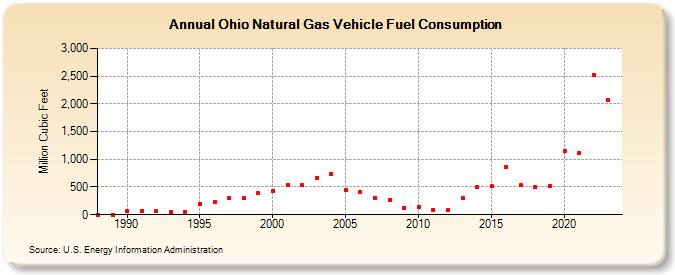
| Ohio Natural Gas Vehicle Fuel Consumption (Million Cubic Feet) | ||||||||
| Decade | Year-0 | Year-1 | Year-2 | Year-3 | Year-4 | Year-5 | Year-6 | Year-7 | Year-8 | Year-9 |
|---|---|---|---|---|---|---|---|---|---|---|
| 1980's | 0 | 0 | ||||||||
| 1990's | 73 | 67 | 59 | 44 | 48 | 187 | 229 | 294 | 309 | 386 |
| 2000's | 424 | 529 | 539 | 659 | 740 | 444 | 403 | 308 | 261 | 130 |
| 2010's | 146 | 88 | 89 | 299 | 501 | 516 | 858 | 527 | 497 | 510 |
| 2020's | 1,141 | 1,105 | 2,521 | 2,062 |
| - = No Data Reported; -- = Not Applicable; NA = Not Available; W = Withheld to avoid disclosure of individual company data. |
| Release Date: 8/30/2024 |
| Next Release Date: 9/30/2024 |