|
Download Data (XLS File) |
|
||||||||
|
||||||||
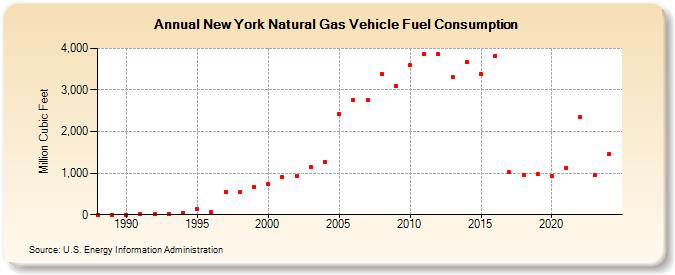
| New York Natural Gas Vehicle Fuel Consumption (Million Cubic Feet) | ||||||||
| Decade | Year-0 | Year-1 | Year-2 | Year-3 | Year-4 | Year-5 | Year-6 | Year-7 | Year-8 | Year-9 |
|---|---|---|---|---|---|---|---|---|---|---|
| 1980's | 0 | 0 | ||||||||
| 1990's | 2 | 25 | 6 | 20 | 53 | 127 | 54 | 557 | 536 | 670 |
| 2000's | 737 | 912 | 930 | 1,137 | 1,276 | 2,425 | 2,762 | 2,758 | 3,386 | 3,098 |
| 2010's | 3,589 | 3,866 | 3,854 | 3,315 | 3,677 | 3,388 | 3,825 | 1,016 | 960 | 970 |
| 2020's | 922 | 1,130 | 2,347 | 1,920 |
| - = No Data Reported; -- = Not Applicable; NA = Not Available; W = Withheld to avoid disclosure of individual company data. |
| Release Date: 3/29/2024 |
| Next Release Date: 4/30/2024 |