|
Download Data (XLS File) |
|
|||||
|
|||||
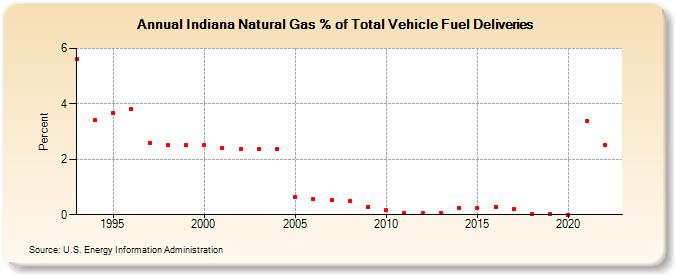
| Indiana Natural Gas % of Total Vehicle Fuel Deliveries (Percent) | |||||
| Decade | Year-0 | Year-1 | Year-2 | Year-3 | Year-4 | Year-5 | Year-6 | Year-7 | Year-8 | Year-9 |
|---|---|---|---|---|---|---|---|---|---|---|
| 1990's | 5.62 | 3.40 | 3.67 | 3.81 | 2.60 | 2.51 | 2.52 | |||
| 2000's | 2.52 | 2.39 | 2.37 | 2.37 | 2.37 | 0.64 | 0.55 | 0.52 | 0.48 | 0.28 |
| 2010's | 0.17 | 0.06 | 0.06 | 0.07 | 0.23 | 0.24 | 0.29 | 0.21 | 0.02 | 0.01 |
| 2020's | 0.00 | 3.38 | 2.50 |
| - = No Data Reported; -- = Not Applicable; NA = Not Available; W = Withheld to avoid disclosure of individual company data. |
| Release Date: 8/30/2024 |
| Next Release Date: 9/30/2024 |