|
Download Data (XLS File) |
|
|||||
|
|||||
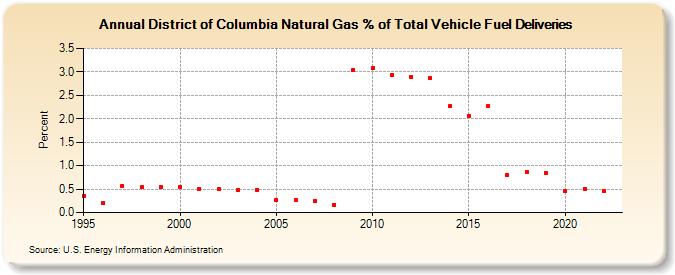
| District of Columbia Natural Gas % of Total Vehicle Fuel Deliveries (Percent) | |||||
| Decade | Year-0 | Year-1 | Year-2 | Year-3 | Year-4 | Year-5 | Year-6 | Year-7 | Year-8 | Year-9 |
|---|---|---|---|---|---|---|---|---|---|---|
| 1990's | 0.36 | 0.21 | 0.57 | 0.54 | 0.54 | |||||
| 2000's | 0.55 | 0.51 | 0.50 | 0.49 | 0.49 | 0.27 | 0.27 | 0.25 | 0.17 | 3.04 |
| 2010's | 3.08 | 2.93 | 2.90 | 2.87 | 2.27 | 2.06 | 2.28 | 0.80 | 0.87 | 0.84 |
| 2020's | 0.45 | 0.50 | 0.45 |
| - = No Data Reported; -- = Not Applicable; NA = Not Available; W = Withheld to avoid disclosure of individual company data. |
| Release Date: 3/29/2024 |
| Next Release Date: 4/30/2024 |