|
Download Data (XLS File) |
|
|||||
|
|||||
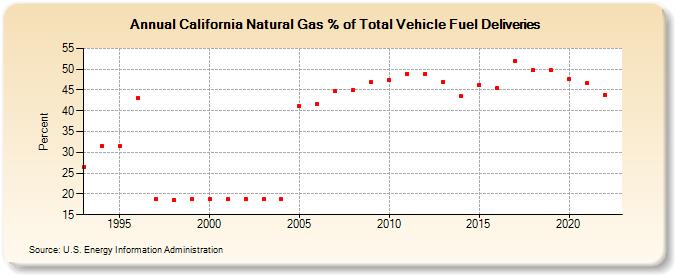
| California Natural Gas % of Total Vehicle Fuel Deliveries (Percent) | |||||
| Decade | Year-0 | Year-1 | Year-2 | Year-3 | Year-4 | Year-5 | Year-6 | Year-7 | Year-8 | Year-9 |
|---|---|---|---|---|---|---|---|---|---|---|
| 1990's | 26.56 | 31.62 | 31.63 | 43.11 | 18.73 | 18.55 | 18.69 | |||
| 2000's | 18.66 | 18.67 | 18.72 | 18.71 | 18.71 | 41.12 | 41.66 | 44.67 | 45.05 | 46.96 |
| 2010's | 47.35 | 48.91 | 48.95 | 47.00 | 43.45 | 46.27 | 45.41 | 52.01 | 49.69 | 49.71 |
| 2020's | 47.60 | 46.70 | 43.89 |
| - = No Data Reported; -- = Not Applicable; NA = Not Available; W = Withheld to avoid disclosure of individual company data. |
| Release Date: 8/30/2024 |
| Next Release Date: 9/30/2024 |