|
Download Data (XLS File) |
|
||||||||
|
||||||||
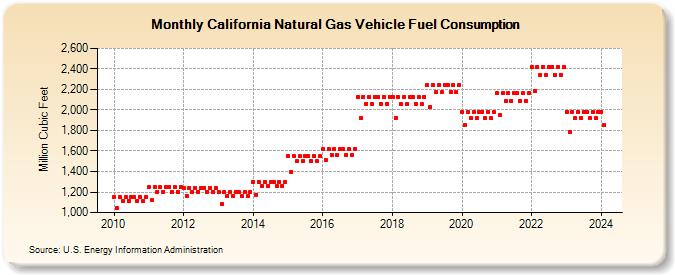
| California Natural Gas Vehicle Fuel Consumption (Million Cubic Feet) | ||||||||
| Year | Jan | Feb | Mar | Apr | May | Jun | Jul | Aug | Sep | Oct | Nov | Dec |
|---|---|---|---|---|---|---|---|---|---|---|---|---|
| 2010 | 1,153 | 1,041 | 1,153 | 1,116 | 1,153 | 1,116 | 1,153 | 1,153 | 1,116 | 1,153 | 1,116 | 1,153 |
| 2011 | 1,245 | 1,125 | 1,245 | 1,205 | 1,245 | 1,205 | 1,245 | 1,245 | 1,205 | 1,245 | 1,205 | 1,245 |
| 2012 | 1,243 | 1,162 | 1,243 | 1,203 | 1,243 | 1,203 | 1,243 | 1,243 | 1,203 | 1,243 | 1,203 | 1,243 |
| 2013 | 1,199 | 1,083 | 1,199 | 1,161 | 1,199 | 1,161 | 1,199 | 1,199 | 1,161 | 1,199 | 1,161 | 1,199 |
| 2014 | 1,302 | 1,176 | 1,302 | 1,260 | 1,302 | 1,260 | 1,302 | 1,302 | 1,260 | 1,302 | 1,260 | 1,302 |
| 2015 | 1,548 | 1,398 | 1,548 | 1,498 | 1,548 | 1,498 | 1,548 | 1,548 | 1,498 | 1,548 | 1,498 | 1,548 |
| 2016 | 1,617 | 1,512 | 1,617 | 1,564 | 1,617 | 1,564 | 1,617 | 1,617 | 1,564 | 1,617 | 1,564 | 1,617 |
| 2017 | 2,129 | 1,923 | 2,129 | 2,061 | 2,129 | 2,061 | 2,129 | 2,129 | 2,061 | 2,129 | 2,061 | 2,129 |
| 2018 | 2,128 | 1,922 | 2,128 | 2,059 | 2,128 | 2,059 | 2,128 | 2,128 | 2,059 | 2,128 | 2,059 | 2,128 |
| 2019 | 2,244 | 2,027 | 2,244 | 2,172 | 2,244 | 2,172 | 2,244 | 2,244 | 2,172 | 2,244 | 2,172 | 2,244 |
| 2020 | 1,981 | 1,853 | 1,981 | 1,917 | 1,981 | 1,917 | 1,981 | 1,981 | 1,917 | 1,981 | 1,917 | 1,981 |
| 2021 | 2,161 | 1,952 | 2,161 | 2,092 | 2,161 | 2,092 | 2,161 | 2,161 | 2,092 | 2,161 | 2,092 | 2,161 |
| 2022 | 2,422 | 2,188 | 2,422 | 2,344 | 2,422 | 2,344 | 2,422 | 2,422 | 2,344 | 2,422 | 2,344 | 2,422 |
| 2023 | 1,981 | 1,789 | 1,981 | 1,917 | 1,981 | 1,917 | 1,981 | 1,981 | 1,917 | 1,981 | 1,917 | 1,981 |
| 2024 | 1,981 | |||||||||||
| - = No Data Reported; -- = Not Applicable; NA = Not Available; W = Withheld to avoid disclosure of individual company data. |
| Release Date: 3/29/2024 |
| Next Release Date: 4/30/2024 |