|
Download Data (XLS File) |
|
|||||
|
|||||
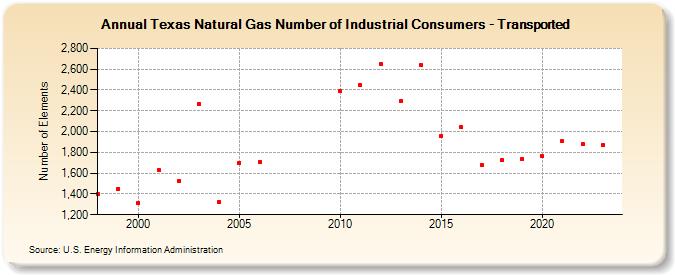
| Texas Natural Gas Number of Industrial Consumers - Transported (Number of Elements) | |||||
| Decade | Year-0 | Year-1 | Year-2 | Year-3 | Year-4 | Year-5 | Year-6 | Year-7 | Year-8 | Year-9 |
|---|---|---|---|---|---|---|---|---|---|---|
| 1990's | 1,403 | 1,449 | ||||||||
| 2000's | 1,311 | 1,628 | 1,525 | 2,269 | 1,322 | 1,702 | 1,710 | |||
| 2010's | 2,388 | 2,445 | 2,651 | 2,291 | 2,638 | 1,959 | 2,040 | 1,677 | 1,723 | 1,734 |
| 2020's | 1,761 | 1,905 | 1,885 |
| - = No Data Reported; -- = Not Applicable; NA = Not Available; W = Withheld to avoid disclosure of individual company data. |
| Release Date: 3/29/2024 |
| Next Release Date: 4/30/2024 |