|
Download Data (XLS File) |
|
|||||
|
|||||
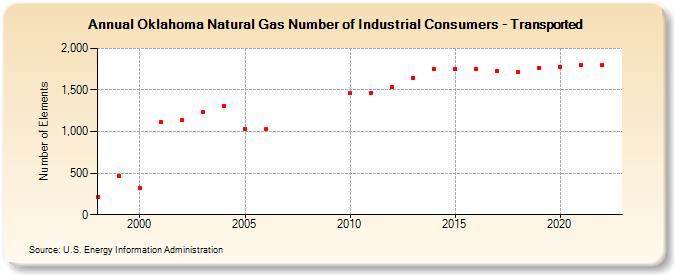
| Oklahoma Natural Gas Number of Industrial Consumers - Transported (Number of Elements) | |||||
| Decade | Year-0 | Year-1 | Year-2 | Year-3 | Year-4 | Year-5 | Year-6 | Year-7 | Year-8 | Year-9 |
|---|---|---|---|---|---|---|---|---|---|---|
| 1990's | 214 | 463 | ||||||||
| 2000's | 319 | 1,111 | 1,141 | 1,233 | 1,308 | 1,031 | 1,025 | |||
| 2010's | 1,462 | 1,469 | 1,537 | 1,644 | 1,750 | 1,754 | 1,752 | 1,729 | 1,722 | 1,764 |
| 2020's | 1,780 | 1,799 | 1,803 |
| - = No Data Reported; -- = Not Applicable; NA = Not Available; W = Withheld to avoid disclosure of individual company data. |
| Release Date: 3/29/2024 |
| Next Release Date: 4/30/2024 |