|
Download Data (XLS File) |
|
|||||
|
|||||
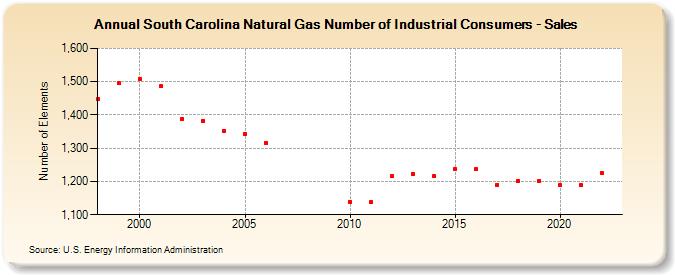
| South Carolina Natural Gas Number of Industrial Consumers - Sales (Number of Elements) | |||||
| Decade | Year-0 | Year-1 | Year-2 | Year-3 | Year-4 | Year-5 | Year-6 | Year-7 | Year-8 | Year-9 |
|---|---|---|---|---|---|---|---|---|---|---|
| 1990's | 1,447 | 1,495 | ||||||||
| 2000's | 1,508 | 1,486 | 1,389 | 1,382 | 1,352 | 1,344 | 1,317 | |||
| 2010's | 1,139 | 1,137 | 1,215 | 1,223 | 1,215 | 1,238 | 1,236 | 1,190 | 1,202 | 1,202 |
| 2020's | 1,189 | 1,188 | 1,225 |
| - = No Data Reported; -- = Not Applicable; NA = Not Available; W = Withheld to avoid disclosure of individual company data. |
| Release Date: 8/30/2024 |
| Next Release Date: 9/30/2024 |