|
Download Data (XLS File) |
|
|||||
|
|||||
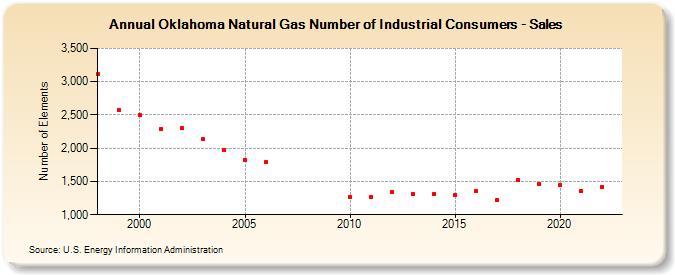
| Oklahoma Natural Gas Number of Industrial Consumers - Sales (Number of Elements) | |||||
| Decade | Year-0 | Year-1 | Year-2 | Year-3 | Year-4 | Year-5 | Year-6 | Year-7 | Year-8 | Year-9 |
|---|---|---|---|---|---|---|---|---|---|---|
| 1990's | 3,116 | 2,577 | ||||||||
| 2000's | 2,502 | 2,292 | 2,297 | 2,134 | 1,975 | 1,824 | 1,786 | |||
| 2010's | 1,269 | 1,264 | 1,335 | 1,314 | 1,312 | 1,296 | 1,351 | 1,214 | 1,524 | 1,464 |
| 2020's | 1,448 | 1,354 | 1,421 | 1,375 | 1,363 |
| - = No Data Reported; -- = Not Applicable; NA = Not Available; W = Withheld to avoid disclosure of individual company data. |
| Release Date: 5/29/2026 |
| Next Release Date: 6/30/2026 |