|
Download Data (XLS File) |
|
|||||
|
|||||
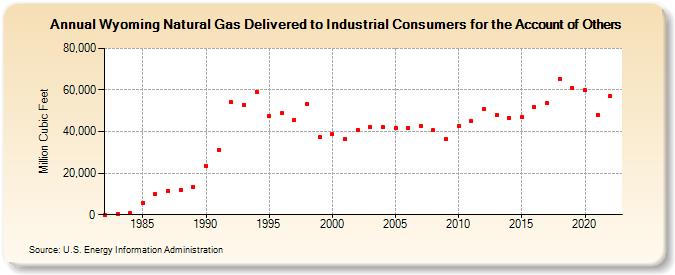
| Wyoming Natural Gas Delivered to Industrial Consumers for the Account of Others (Million Cubic Feet) | |||||
| Decade | Year-0 | Year-1 | Year-2 | Year-3 | Year-4 | Year-5 | Year-6 | Year-7 | Year-8 | Year-9 |
|---|---|---|---|---|---|---|---|---|---|---|
| 1980's | 0 | 445 | 649 | 5,861 | 9,836 | 11,400 | 12,051 | 13,496 | ||
| 1990's | 23,569 | 31,093 | 54,053 | 52,935 | 59,219 | 47,467 | 48,798 | 45,763 | 53,151 | 37,346 |
| 2000's | 38,589 | 36,200 | 40,874 | 42,238 | 42,187 | 41,685 | 41,948 | 42,531 | 40,569 | 36,470 |
| 2010's | 42,644 | 44,995 | 50,731 | 47,790 | 46,531 | 46,763 | 51,855 | 53,587 | 65,325 | 61,043 |
| 2020's | 59,820 | 48,202 | 57,079 |
| - = No Data Reported; -- = Not Applicable; NA = Not Available; W = Withheld to avoid disclosure of individual company data. |
| Release Date: 3/29/2024 |
| Next Release Date: 4/30/2024 |