|
Download Data (XLS File) |
|
|||||
|
|||||
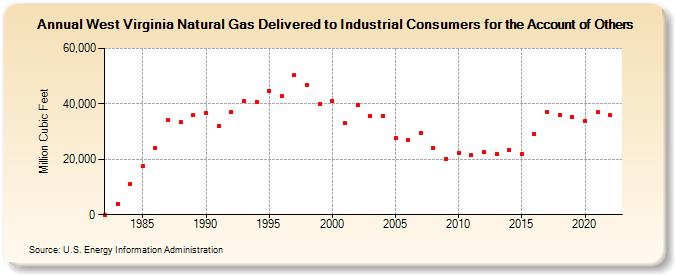
| West Virginia Natural Gas Delivered to Industrial Consumers for the Account of Others (Million Cubic Feet) | |||||
| Decade | Year-0 | Year-1 | Year-2 | Year-3 | Year-4 | Year-5 | Year-6 | Year-7 | Year-8 | Year-9 |
|---|---|---|---|---|---|---|---|---|---|---|
| 1980's | 1 | 4,027 | 11,006 | 17,650 | 24,203 | 34,008 | 33,433 | 35,992 | ||
| 1990's | 36,632 | 32,142 | 37,034 | 40,863 | 40,684 | 44,726 | 42,843 | 50,353 | 46,650 | 40,005 |
| 2000's | 41,038 | 33,034 | 39,699 | 35,554 | 35,753 | 27,601 | 26,798 | 29,568 | 24,116 | 20,180 |
| 2010's | 22,210 | 21,478 | 22,537 | 21,954 | 23,467 | 21,789 | 29,180 | 36,911 | 35,971 | 35,302 |
| 2020's | 33,850 | 36,896 | 35,893 |
| - = No Data Reported; -- = Not Applicable; NA = Not Available; W = Withheld to avoid disclosure of individual company data. |
| Release Date: 3/29/2024 |
| Next Release Date: 4/30/2024 |