|
Download Data (XLS File) |
|
|||||
|
|||||
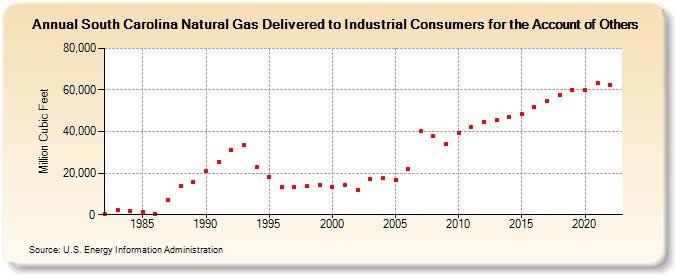
| South Carolina Natural Gas Delivered to Industrial Consumers for the Account of Others (Million Cubic Feet) | |||||
| Decade | Year-0 | Year-1 | Year-2 | Year-3 | Year-4 | Year-5 | Year-6 | Year-7 | Year-8 | Year-9 |
|---|---|---|---|---|---|---|---|---|---|---|
| 1980's | 229 | 2,217 | 1,819 | 1,106 | 422 | 7,308 | 13,667 | 15,959 | ||
| 1990's | 20,817 | 25,368 | 31,176 | 33,507 | 22,755 | 18,336 | 13,562 | 13,525 | 13,602 | 14,235 |
| 2000's | 13,130 | 14,238 | 11,871 | 16,980 | 17,431 | 16,752 | 22,107 | 40,184 | 37,898 | 33,892 |
| 2010's | 39,347 | 42,026 | 44,529 | 45,587 | 46,989 | 48,451 | 51,773 | 54,610 | 57,526 | 60,022 |
| 2020's | 59,993 | 63,178 | 62,299 |
| - = No Data Reported; -- = Not Applicable; NA = Not Available; W = Withheld to avoid disclosure of individual company data. |
| Release Date: 8/30/2024 |
| Next Release Date: 9/30/2024 |