|
Download Data (XLS File) |
|
|||||
|
|||||
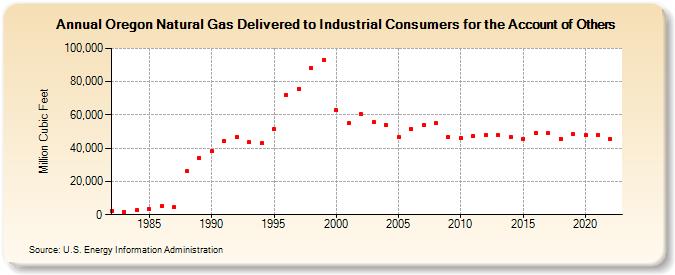
| Oregon Natural Gas Delivered to Industrial Consumers for the Account of Others (Million Cubic Feet) | |||||
| Decade | Year-0 | Year-1 | Year-2 | Year-3 | Year-4 | Year-5 | Year-6 | Year-7 | Year-8 | Year-9 |
|---|---|---|---|---|---|---|---|---|---|---|
| 1980's | 2,091 | 1,752 | 2,586 | 3,264 | 5,255 | 4,483 | 26,019 | 34,133 | ||
| 1990's | 38,128 | 44,521 | 46,434 | 43,558 | 42,891 | 51,352 | 71,942 | 75,666 | 88,092 | 93,293 |
| 2000's | 62,767 | 54,858 | 60,323 | 55,670 | 53,860 | 46,535 | 51,474 | 53,825 | 54,930 | 46,499 |
| 2010's | 46,300 | 47,207 | 47,895 | 47,690 | 46,799 | 45,594 | 49,423 | 48,866 | 45,811 | 48,254 |
| 2020's | 47,647 | 48,217 | 45,530 |
| - = No Data Reported; -- = Not Applicable; NA = Not Available; W = Withheld to avoid disclosure of individual company data. |
| Release Date: 3/29/2024 |
| Next Release Date: 4/30/2024 |