|
Download Data (XLS File) |
|
|||||
|
|||||
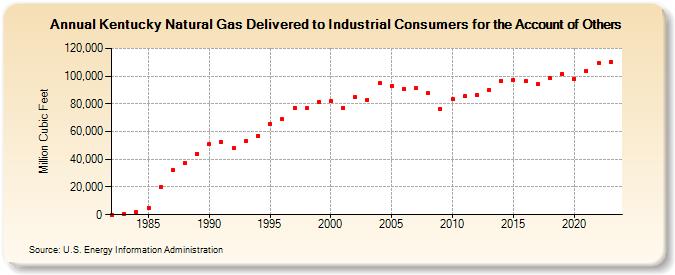
| Kentucky Natural Gas Delivered to Industrial Consumers for the Account of Others (Million Cubic Feet) | |||||
| Decade | Year-0 | Year-1 | Year-2 | Year-3 | Year-4 | Year-5 | Year-6 | Year-7 | Year-8 | Year-9 |
|---|---|---|---|---|---|---|---|---|---|---|
| 1980's | 0 | 632 | 1,669 | 5,137 | 20,113 | 32,085 | 37,451 | 44,164 | ||
| 1990's | 50,673 | 52,422 | 47,776 | 53,163 | 57,149 | 65,659 | 68,850 | 77,303 | 76,644 | 81,483 |
| 2000's | 82,032 | 77,187 | 84,889 | 83,089 | 95,004 | 93,096 | 91,034 | 91,085 | 87,459 | 76,499 |
| 2010's | 83,371 | 85,324 | 86,729 | 90,102 | 96,496 | 97,172 | 96,245 | 94,302 | 98,363 | 101,783 |
| 2020's | 98,230 | 103,972 | 109,563 |
| - = No Data Reported; -- = Not Applicable; NA = Not Available; W = Withheld to avoid disclosure of individual company data. |
| Release Date: 3/29/2024 |
| Next Release Date: 4/30/2024 |