|
Download Data (XLS File) |
|
|||||
|
|||||
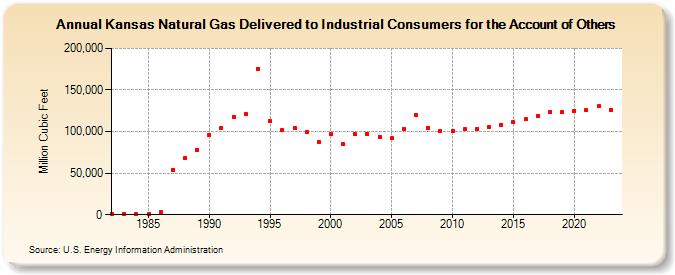
| Kansas Natural Gas Delivered to Industrial Consumers for the Account of Others (Million Cubic Feet) | |||||
| Decade | Year-0 | Year-1 | Year-2 | Year-3 | Year-4 | Year-5 | Year-6 | Year-7 | Year-8 | Year-9 |
|---|---|---|---|---|---|---|---|---|---|---|
| 1980's | 1,102 | 995 | 834 | 1,385 | 3,049 | 53,844 | 68,052 | 78,314 | ||
| 1990's | 95,606 | 104,828 | 117,419 | 120,962 | 175,691 | 112,942 | 101,877 | 104,868 | 99,942 | 87,430 |
| 2000's | 97,354 | 84,718 | 96,678 | 96,508 | 93,874 | 91,673 | 102,868 | 119,338 | 104,753 | 100,367 |
| 2010's | 100,913 | 102,584 | 103,631 | 105,902 | 108,408 | 111,146 | 114,583 | 118,771 | 124,067 | 123,324 |
| 2020's | 125,014 | 125,452 | 130,246 |
| - = No Data Reported; -- = Not Applicable; NA = Not Available; W = Withheld to avoid disclosure of individual company data. |
| Release Date: 8/30/2024 |
| Next Release Date: 9/30/2024 |