|
Download Data (XLS File) |
|
|||||
|
|||||
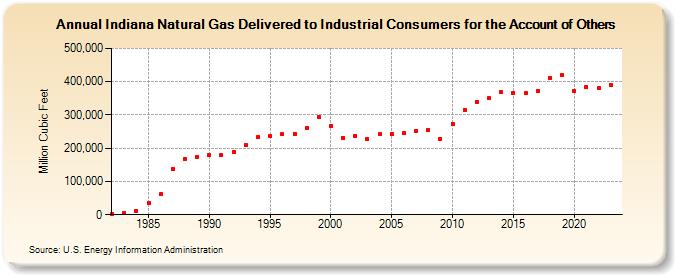
| Indiana Natural Gas Delivered to Industrial Consumers for the Account of Others (Million Cubic Feet) | |||||
| Decade | Year-0 | Year-1 | Year-2 | Year-3 | Year-4 | Year-5 | Year-6 | Year-7 | Year-8 | Year-9 |
|---|---|---|---|---|---|---|---|---|---|---|
| 1980's | 821 | 4,536 | 10,798 | 33,802 | 61,473 | 136,458 | 167,798 | 172,022 | ||
| 1990's | 179,733 | 178,941 | 188,562 | 210,303 | 233,870 | 236,435 | 241,236 | 243,621 | 260,480 | 293,613 |
| 2000's | 267,819 | 231,382 | 236,898 | 226,164 | 241,144 | 243,071 | 244,934 | 252,305 | 253,932 | 227,724 |
| 2010's | 273,607 | 315,055 | 338,258 | 349,462 | 367,876 | 365,346 | 364,459 | 372,921 | 412,425 | 420,104 |
| 2020's | 371,345 | 382,522 | 380,397 |
| - = No Data Reported; -- = Not Applicable; NA = Not Available; W = Withheld to avoid disclosure of individual company data. |
| Release Date: 3/29/2024 |
| Next Release Date: 4/30/2024 |