|
Download Data (XLS File) |
|
|||||
|
|||||
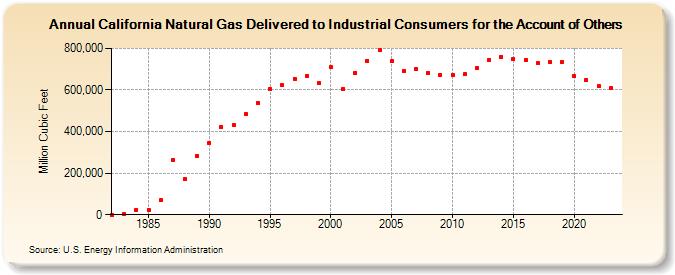
| California Natural Gas Delivered to Industrial Consumers for the Account of Others (Million Cubic Feet) | |||||
| Decade | Year-0 | Year-1 | Year-2 | Year-3 | Year-4 | Year-5 | Year-6 | Year-7 | Year-8 | Year-9 |
|---|---|---|---|---|---|---|---|---|---|---|
| 1980's | 0 | 1,065 | 23,185 | 23,762 | 68,982 | 263,991 | 171,228 | 283,611 | ||
| 1990's | 346,643 | 422,738 | 430,836 | 485,326 | 537,503 | 604,196 | 622,182 | 654,775 | 668,350 | 632,097 |
| 2000's | 708,289 | 606,097 | 682,886 | 740,589 | 791,981 | 738,704 | 690,491 | 699,283 | 683,512 | 673,034 |
| 2010's | 671,372 | 674,420 | 704,680 | 744,986 | 759,369 | 747,210 | 744,005 | 728,926 | 735,230 | 735,748 |
| 2020's | 666,288 | 648,671 | 618,992 |
| - = No Data Reported; -- = Not Applicable; NA = Not Available; W = Withheld to avoid disclosure of individual company data. |
| Release Date: 3/29/2024 |
| Next Release Date: 4/30/2024 |