|
Download Data (XLS File) |
|
|||||
|
|||||
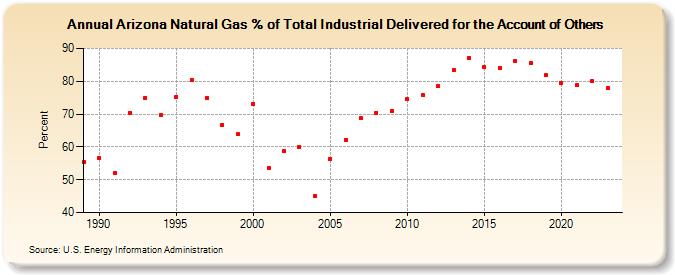
| Arizona Natural Gas % of Total Industrial Delivered for the Account of Others (Percent) | |||||
| Decade | Year-0 | Year-1 | Year-2 | Year-3 | Year-4 | Year-5 | Year-6 | Year-7 | Year-8 | Year-9 |
|---|---|---|---|---|---|---|---|---|---|---|
| 1980's | 55.5 | |||||||||
| 1990's | 56.7 | 51.9 | 70.4 | 75.0 | 69.7 | 75.3 | 80.3 | 74.9 | 66.6 | 63.8 |
| 2000's | 73.2 | 53.6 | 58.8 | 60.0 | 44.9 | 56.4 | 62.1 | 68.7 | 70.4 | 70.9 |
| 2010's | 74.5 | 75.8 | 78.6 | 83.4 | 87.2 | 84.2 | 84.1 | 86.2 | 85.6 | 81.8 |
| 2020's | 79.5 | 78.7 | 80.0 |
| - = No Data Reported; -- = Not Applicable; NA = Not Available; W = Withheld to avoid disclosure of individual company data. |
| Release Date: 3/29/2024 |
| Next Release Date: 4/30/2024 |