|
Download Data (XLS File) |
|
|||||
|
|||||
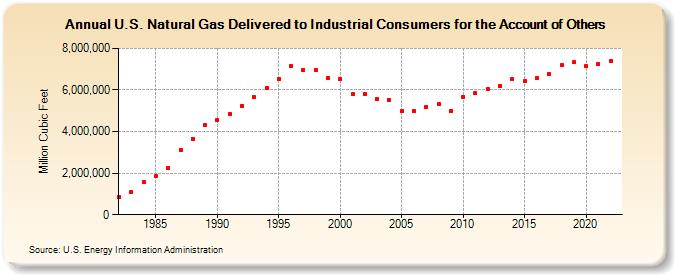
| U.S. Natural Gas Delivered to Industrial Consumers for the Account of Others (Million Cubic Feet) | |||||
| Decade | Year-0 | Year-1 | Year-2 | Year-3 | Year-4 | Year-5 | Year-6 | Year-7 | Year-8 | Year-9 |
|---|---|---|---|---|---|---|---|---|---|---|
| 1980's | 867,124 | 1,087,737 | 1,559,503 | 1,839,611 | 2,240,381 | 3,128,899 | 3,663,187 | 4,297,693 | ||
| 1990's | 4,544,535 | 4,863,923 | 5,248,609 | 5,644,894 | 6,112,919 | 6,517,352 | 7,151,885 | 6,969,318 | 6,984,012 | 6,564,492 |
| 2000's | 6,529,240 | 5,813,726 | 5,802,752 | 5,568,750 | 5,528,981 | 5,010,572 | 4,986,888 | 5,178,329 | 5,307,954 | 5,008,265 |
| 2010's | 5,651,037 | 5,856,115 | 6,055,805 | 6,194,960 | 6,509,864 | 6,409,025 | 6,578,240 | 6,768,533 | 7,194,582 | 7,325,264 |
| 2020's | 7,140,003 | 7,257,024 | 7,391,238 |
| - = No Data Reported; -- = Not Applicable; NA = Not Available; W = Withheld to avoid disclosure of individual company data. |
| Release Date: 8/30/2024 |
| Next Release Date: 9/30/2024 |