|
Download Data (XLS File) |
|
|||||
|
|||||
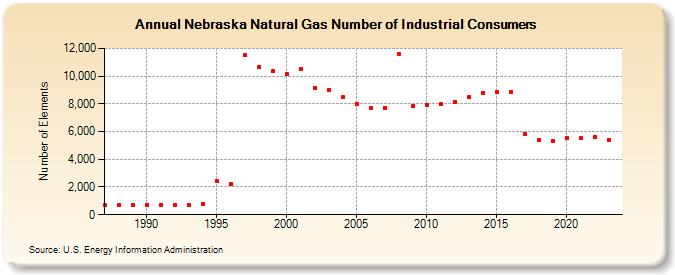
| Nebraska Natural Gas Number of Industrial Consumers (Number of Elements) | |||||
| Decade | Year-0 | Year-1 | Year-2 | Year-3 | Year-4 | Year-5 | Year-6 | Year-7 | Year-8 | Year-9 |
|---|---|---|---|---|---|---|---|---|---|---|
| 1980's | 675 | 684 | 702 | |||||||
| 1990's | 712 | 718 | 696 | 718 | 766 | 2,432 | 2,234 | 11,553 | 10,673 | 10,342 |
| 2000's | 10,161 | 10,504 | 9,156 | 9,022 | 8,463 | 7,973 | 7,697 | 7,668 | 11,627 | 7,863 |
| 2010's | 7,912 | 7,955 | 8,160 | 8,495 | 8,791 | 8,868 | 8,847 | 5,821 | 5,379 | 5,311 |
| 2020's | 5,526 | 5,507 | 5,624 |
| - = No Data Reported; -- = Not Applicable; NA = Not Available; W = Withheld to avoid disclosure of individual company data. |
| Release Date: 4/30/2024 |
| Next Release Date: 5/31/2024 |