|
Download Data (XLS File) |
|
|||||
|
|||||
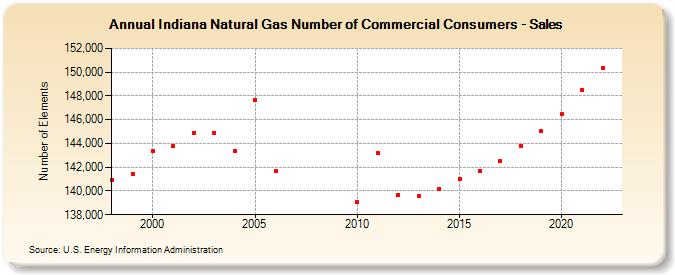
| Indiana Natural Gas Number of Commercial Consumers - Sales (Number of Elements) | |||||
| Decade | Year-0 | Year-1 | Year-2 | Year-3 | Year-4 | Year-5 | Year-6 | Year-7 | Year-8 | Year-9 |
|---|---|---|---|---|---|---|---|---|---|---|
| 1990's | 140,919 | 141,433 | ||||||||
| 2000's | 143,398 | 143,787 | 144,860 | 144,878 | 143,393 | 147,672 | 141,695 | |||
| 2010's | 139,058 | 143,227 | 139,676 | 139,589 | 140,196 | 141,013 | 141,679 | 142,540 | 143,793 | 145,034 |
| 2020's | 146,476 | 148,500 | 150,343 |
| - = No Data Reported; -- = Not Applicable; NA = Not Available; W = Withheld to avoid disclosure of individual company data. |
| Release Date: 3/29/2024 |
| Next Release Date: 4/30/2024 |