|
Download Data (XLS File) |
|
|||||
|
|||||
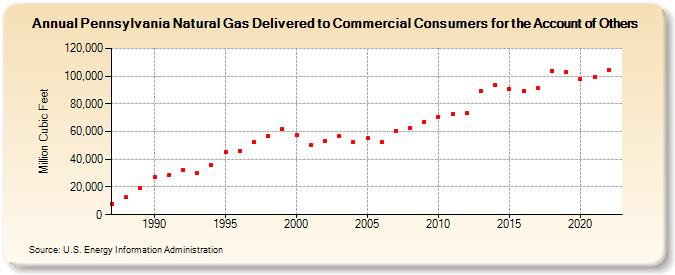
| Pennsylvania Natural Gas Delivered to Commercial Consumers for the Account of Others (Million Cubic Feet) | |||||
| Decade | Year-0 | Year-1 | Year-2 | Year-3 | Year-4 | Year-5 | Year-6 | Year-7 | Year-8 | Year-9 |
|---|---|---|---|---|---|---|---|---|---|---|
| 1980's | 7,787 | 12,476 | 19,406 | |||||||
| 1990's | 27,144 | 28,528 | 32,481 | 29,758 | 35,514 | 45,481 | 45,809 | 52,464 | 56,528 | 61,752 |
| 2000's | 57,397 | 50,476 | 53,048 | 56,590 | 52,546 | 55,148 | 52,334 | 60,506 | 62,616 | 67,105 |
| 2010's | 70,514 | 72,719 | 73,461 | 89,150 | 93,493 | 90,958 | 89,311 | 91,295 | 103,872 | 102,840 |
| 2020's | 97,599 | 99,284 | 104,644 |
| - = No Data Reported; -- = Not Applicable; NA = Not Available; W = Withheld to avoid disclosure of individual company data. |
| Release Date: 3/29/2024 |
| Next Release Date: 4/30/2024 |