|
Download Data (XLS File) |
|
|||||
|
|||||
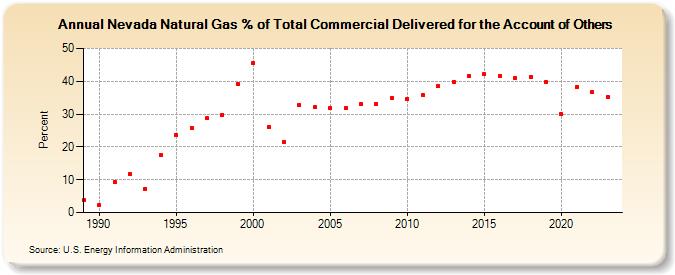
| Nevada Natural Gas % of Total Commercial Delivered for the Account of Others (Percent) | |||||
| Decade | Year-0 | Year-1 | Year-2 | Year-3 | Year-4 | Year-5 | Year-6 | Year-7 | Year-8 | Year-9 |
|---|---|---|---|---|---|---|---|---|---|---|
| 1980's | 3.8 | |||||||||
| 1990's | 2.3 | 9.2 | 11.7 | 7.3 | 17.5 | 23.6 | 25.8 | 28.7 | 29.8 | 39.1 |
| 2000's | 45.4 | 26.1 | 21.5 | 32.8 | 32.1 | 31.9 | 31.8 | 33.0 | 33.0 | 34.9 |
| 2010's | 34.6 | 35.7 | 38.6 | 39.9 | 41.6 | 42.1 | 41.5 | 40.9 | 41.4 | 39.8 |
| 2020's | 30.0 | 38.3 | 36.7 |
| - = No Data Reported; -- = Not Applicable; NA = Not Available; W = Withheld to avoid disclosure of individual company data. |
| Release Date: 3/29/2024 |
| Next Release Date: 4/30/2024 |