|
Download Data (XLS File) |
|
|||||
|
|||||
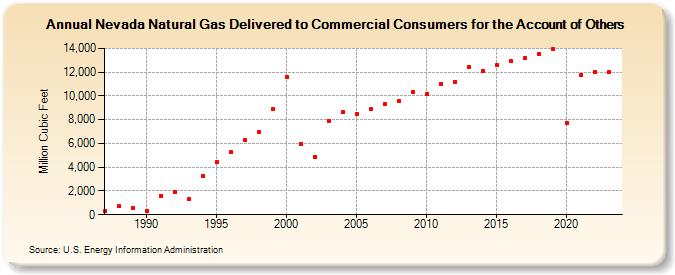
| Nevada Natural Gas Delivered to Commercial Consumers for the Account of Others (Million Cubic Feet) | |||||
| Decade | Year-0 | Year-1 | Year-2 | Year-3 | Year-4 | Year-5 | Year-6 | Year-7 | Year-8 | Year-9 |
|---|---|---|---|---|---|---|---|---|---|---|
| 1980's | 287 | 725 | 575 | |||||||
| 1990's | 346 | 1,563 | 1,889 | 1,283 | 3,276 | 4,416 | 5,272 | 6,305 | 6,941 | 8,888 |
| 2000's | 11,621 | 5,988 | 4,885 | 7,914 | 8,630 | 8,479 | 8,910 | 9,311 | 9,540 | 10,305 |
| 2010's | 10,197 | 10,971 | 11,195 | 12,442 | 12,120 | 12,581 | 12,926 | 13,167 | 13,558 | 13,990 |
| 2020's | 7,760 | 11,764 | 12,033 |
| - = No Data Reported; -- = Not Applicable; NA = Not Available; W = Withheld to avoid disclosure of individual company data. |
| Release Date: 3/29/2024 |
| Next Release Date: 4/30/2024 |