|
Download Data (XLS File) |
|
|||||
|
|||||
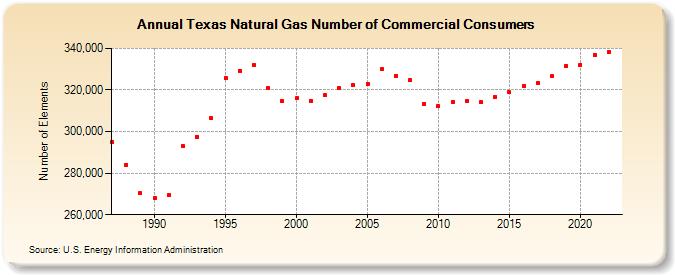
| Texas Natural Gas Number of Commercial Consumers (Number of Elements) | |||||
| Decade | Year-0 | Year-1 | Year-2 | Year-3 | Year-4 | Year-5 | Year-6 | Year-7 | Year-8 | Year-9 |
|---|---|---|---|---|---|---|---|---|---|---|
| 1980's | 294,879 | 284,013 | 270,227 | |||||||
| 1990's | 268,181 | 269,411 | 292,990 | 297,516 | 306,376 | 325,785 | 329,287 | 332,077 | 320,922 | 314,598 |
| 2000's | 315,906 | 314,858 | 317,446 | 320,786 | 322,242 | 322,999 | 329,918 | 326,812 | 324,671 | 313,384 |
| 2010's | 312,277 | 314,041 | 314,811 | 314,036 | 316,756 | 318,845 | 321,795 | 323,355 | 326,594 | 331,757 |
| 2020's | 332,158 | 336,934 | 338,364 |
| - = No Data Reported; -- = Not Applicable; NA = Not Available; W = Withheld to avoid disclosure of individual company data. |
| Release Date: 8/30/2024 |
| Next Release Date: 9/30/2024 |