|
Download Data (XLS File) |
|
|||||
|
|||||
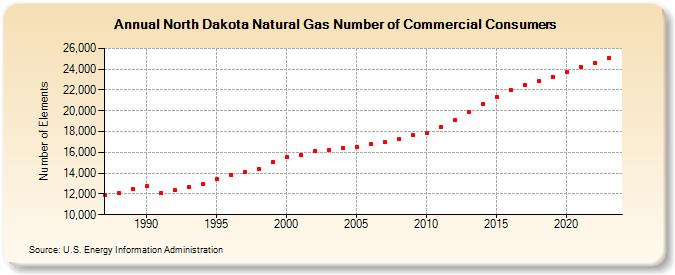
| North Dakota Natural Gas Number of Commercial Consumers (Number of Elements) | |||||
| Decade | Year-0 | Year-1 | Year-2 | Year-3 | Year-4 | Year-5 | Year-6 | Year-7 | Year-8 | Year-9 |
|---|---|---|---|---|---|---|---|---|---|---|
| 1980's | 11,905 | 12,104 | 12,454 | |||||||
| 1990's | 12,742 | 12,082 | 12,353 | 12,650 | 12,944 | 13,399 | 13,789 | 14,099 | 14,422 | 15,050 |
| 2000's | 15,531 | 15,740 | 16,093 | 16,202 | 16,443 | 16,518 | 16,848 | 17,013 | 17,284 | 17,632 |
| 2010's | 17,823 | 18,421 | 19,089 | 19,855 | 20,687 | 21,345 | 22,023 | 22,474 | 22,880 | 23,280 |
| 2020's | 23,685 | 24,205 | 24,599 |
| - = No Data Reported; -- = Not Applicable; NA = Not Available; W = Withheld to avoid disclosure of individual company data. |
| Release Date: 4/30/2024 |
| Next Release Date: 5/31/2024 |