|
Download Data (XLS File) |
|
|||||
|
|||||
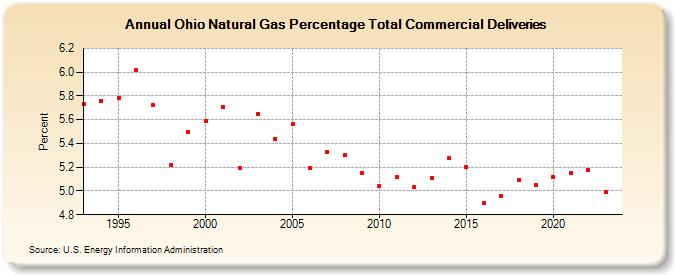
| Ohio Natural Gas Percentage Total Commercial Deliveries (Percent) | |||||
| Decade | Year-0 | Year-1 | Year-2 | Year-3 | Year-4 | Year-5 | Year-6 | Year-7 | Year-8 | Year-9 |
|---|---|---|---|---|---|---|---|---|---|---|
| 1990's | 5.73 | 5.76 | 5.78 | 6.02 | 5.72 | 5.22 | 5.50 | |||
| 2000's | 5.59 | 5.71 | 5.19 | 5.65 | 5.44 | 5.56 | 5.19 | 5.33 | 5.30 | 5.15 |
| 2010's | 5.04 | 5.12 | 5.03 | 5.11 | 5.28 | 5.20 | 4.90 | 4.96 | 5.09 | 5.05 |
| 2020's | 5.12 | 5.15 | 5.18 |
| - = No Data Reported; -- = Not Applicable; NA = Not Available; W = Withheld to avoid disclosure of individual company data. |
| Release Date: 3/29/2024 |
| Next Release Date: 4/30/2024 |