|
Download Data (XLS File) |
|
|||||
|
|||||
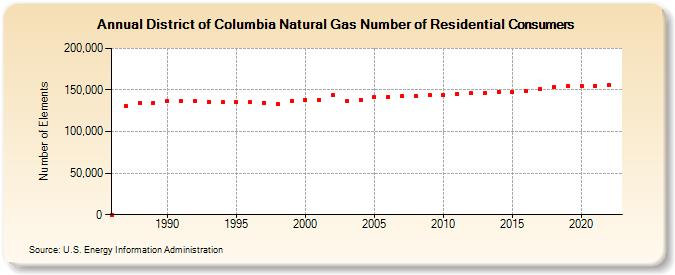
| District of Columbia Natural Gas Number of Residential Consumers (Number of Elements) | |||||
| Decade | Year-0 | Year-1 | Year-2 | Year-3 | Year-4 | Year-5 | Year-6 | Year-7 | Year-8 | Year-9 |
|---|---|---|---|---|---|---|---|---|---|---|
| 1980's | 134 | 130,748 | 134,758 | 134,837 | ||||||
| 1990's | 136,183 | 136,629 | 136,438 | 135,986 | 135,119 | 135,299 | 135,215 | 134,807 | 132,867 | 137,206 |
| 2000's | 138,252 | 138,412 | 143,874 | 136,258 | 138,134 | 141,012 | 141,953 | 142,384 | 142,819 | 143,436 |
| 2010's | 144,151 | 145,524 | 145,938 | 146,712 | 147,877 | 147,895 | 148,545 | 151,125 | 153,691 | 154,375 |
| 2020's | 155,294 | 155,091 | 155,638 |
| - = No Data Reported; -- = Not Applicable; NA = Not Available; W = Withheld to avoid disclosure of individual company data. |
| Release Date: 3/29/2024 |
| Next Release Date: 4/30/2024 |