|
Download Data (XLS File) |
|
|||||
|
|||||
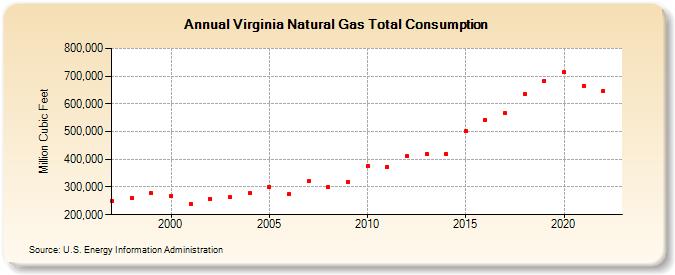
| Virginia Natural Gas Total Consumption (Million Cubic Feet) | |||||
| Decade | Year-0 | Year-1 | Year-2 | Year-3 | Year-4 | Year-5 | Year-6 | Year-7 | Year-8 | Year-9 |
|---|---|---|---|---|---|---|---|---|---|---|
| 1990's | 248,960 | 260,332 | 276,793 | |||||||
| 2000's | 268,770 | 237,853 | 258,202 | 262,970 | 277,434 | 299,746 | 274,175 | 319,913 | 299,364 | 319,134 |
| 2010's | 375,421 | 373,444 | 410,106 | 418,506 | 419,705 | 500,477 | 543,343 | 566,676 | 634,162 | 683,049 |
| 2020's | 713,443 | 666,049 | 646,591 |
| - = No Data Reported; -- = Not Applicable; NA = Not Available; W = Withheld to avoid disclosure of individual company data. |
| Release Date: 4/30/2024 |
| Next Release Date: 5/31/2024 |