|
Download Data (XLS File) |
|
|||||
|
|||||
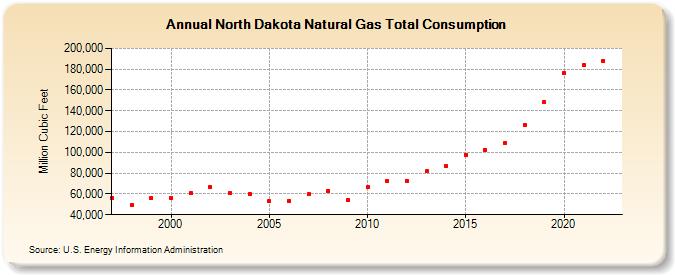
| North Dakota Natural Gas Total Consumption (Million Cubic Feet) | |||||
| Decade | Year-0 | Year-1 | Year-2 | Year-3 | Year-4 | Year-5 | Year-6 | Year-7 | Year-8 | Year-9 |
|---|---|---|---|---|---|---|---|---|---|---|
| 1990's | 56,179 | 49,541 | 56,418 | |||||||
| 2000's | 56,528 | 60,819 | 66,726 | 60,907 | 59,986 | 53,050 | 53,336 | 59,453 | 63,097 | 54,564 |
| 2010's | 66,395 | 72,463 | 72,740 | 81,593 | 86,881 | 97,725 | 102,322 | 109,440 | 126,325 | 148,302 |
| 2020's | 176,037 | 183,999 | 188,102 |
| - = No Data Reported; -- = Not Applicable; NA = Not Available; W = Withheld to avoid disclosure of individual company data. |
| Release Date: 3/29/2024 |
| Next Release Date: 4/30/2024 |