|
Download Data (XLS File) |
|
|||||
|
|||||
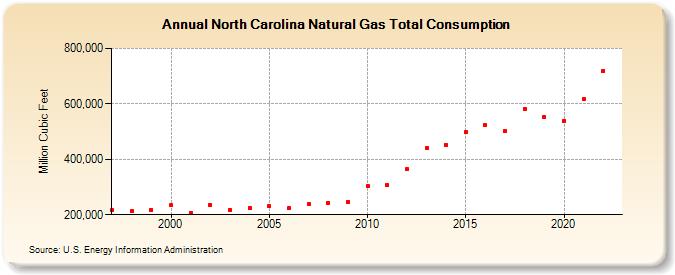
| North Carolina Natural Gas Total Consumption (Million Cubic Feet) | |||||
| Decade | Year-0 | Year-1 | Year-2 | Year-3 | Year-4 | Year-5 | Year-6 | Year-7 | Year-8 | Year-9 |
|---|---|---|---|---|---|---|---|---|---|---|
| 1990's | 215,634 | 214,092 | 217,159 | |||||||
| 2000's | 233,714 | 207,108 | 235,376 | 218,642 | 224,796 | 229,715 | 223,032 | 237,354 | 243,090 | 247,047 |
| 2010's | 304,148 | 307,804 | 363,945 | 440,175 | 452,780 | 498,576 | 522,002 | 502,567 | 582,418 | 552,284 |
| 2020's | 539,759 | 616,589 | 720,007 |
| - = No Data Reported; -- = Not Applicable; NA = Not Available; W = Withheld to avoid disclosure of individual company data. |
| Release Date: 8/30/2024 |
| Next Release Date: 9/30/2024 |