|
Download Data (XLS File) |
|
|||||
|
|||||
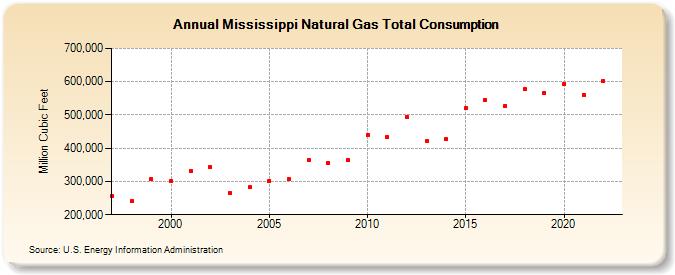
| Mississippi Natural Gas Total Consumption (Million Cubic Feet) | |||||
| Decade | Year-0 | Year-1 | Year-2 | Year-3 | Year-4 | Year-5 | Year-6 | Year-7 | Year-8 | Year-9 |
|---|---|---|---|---|---|---|---|---|---|---|
| 1990's | 255,475 | 241,342 | 306,733 | |||||||
| 2000's | 300,652 | 332,589 | 343,890 | 265,842 | 282,051 | 301,663 | 307,305 | 364,067 | 355,006 | 364,323 |
| 2010's | 438,733 | 433,538 | 494,016 | 420,594 | 427,584 | 521,355 | 544,464 | 526,862 | 576,888 | 567,348 |
| 2020's | 593,085 | 560,645 | 602,036 |
| - = No Data Reported; -- = Not Applicable; NA = Not Available; W = Withheld to avoid disclosure of individual company data. |
| Release Date: 3/29/2024 |
| Next Release Date: 4/30/2024 |