|
Download Data (XLS File) |
|
|||||
|
|||||
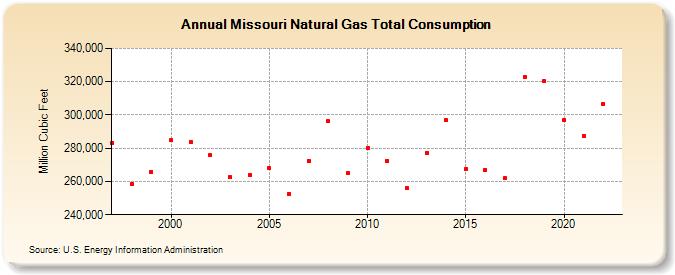
| Missouri Natural Gas Total Consumption (Million Cubic Feet) | |||||
| Decade | Year-0 | Year-1 | Year-2 | Year-3 | Year-4 | Year-5 | Year-6 | Year-7 | Year-8 | Year-9 |
|---|---|---|---|---|---|---|---|---|---|---|
| 1990's | 283,294 | 258,652 | 265,798 | |||||||
| 2000's | 284,763 | 283,793 | 275,629 | 262,529 | 263,945 | 268,040 | 252,697 | 272,536 | 296,058 | 264,867 |
| 2010's | 280,181 | 272,583 | 255,875 | 276,967 | 297,087 | 267,673 | 267,170 | 261,993 | 322,805 | 320,115 |
| 2020's | 296,891 | 287,330 | 306,590 |
| - = No Data Reported; -- = Not Applicable; NA = Not Available; W = Withheld to avoid disclosure of individual company data. |
| Release Date: 3/29/2024 |
| Next Release Date: 4/30/2024 |