|
Download Data (XLS File) |
|
|||||
|
|||||
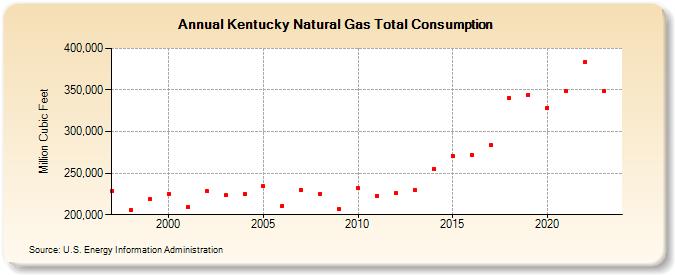
| Kentucky Natural Gas Total Consumption (Million Cubic Feet) | |||||
| Decade | Year-0 | Year-1 | Year-2 | Year-3 | Year-4 | Year-5 | Year-6 | Year-7 | Year-8 | Year-9 |
|---|---|---|---|---|---|---|---|---|---|---|
| 1990's | 227,931 | 205,129 | 218,399 | |||||||
| 2000's | 225,168 | 208,974 | 227,920 | 223,226 | 225,470 | 234,080 | 211,049 | 229,799 | 225,295 | 206,833 |
| 2010's | 232,099 | 223,034 | 225,924 | 229,983 | 255,434 | 270,958 | 271,845 | 283,678 | 340,125 | 344,326 |
| 2020's | 328,830 | 349,263 | 386,001 |
| - = No Data Reported; -- = Not Applicable; NA = Not Available; W = Withheld to avoid disclosure of individual company data. |
| Release Date: 4/30/2024 |
| Next Release Date: 5/31/2024 |